
What would EGP 10,000 have become?
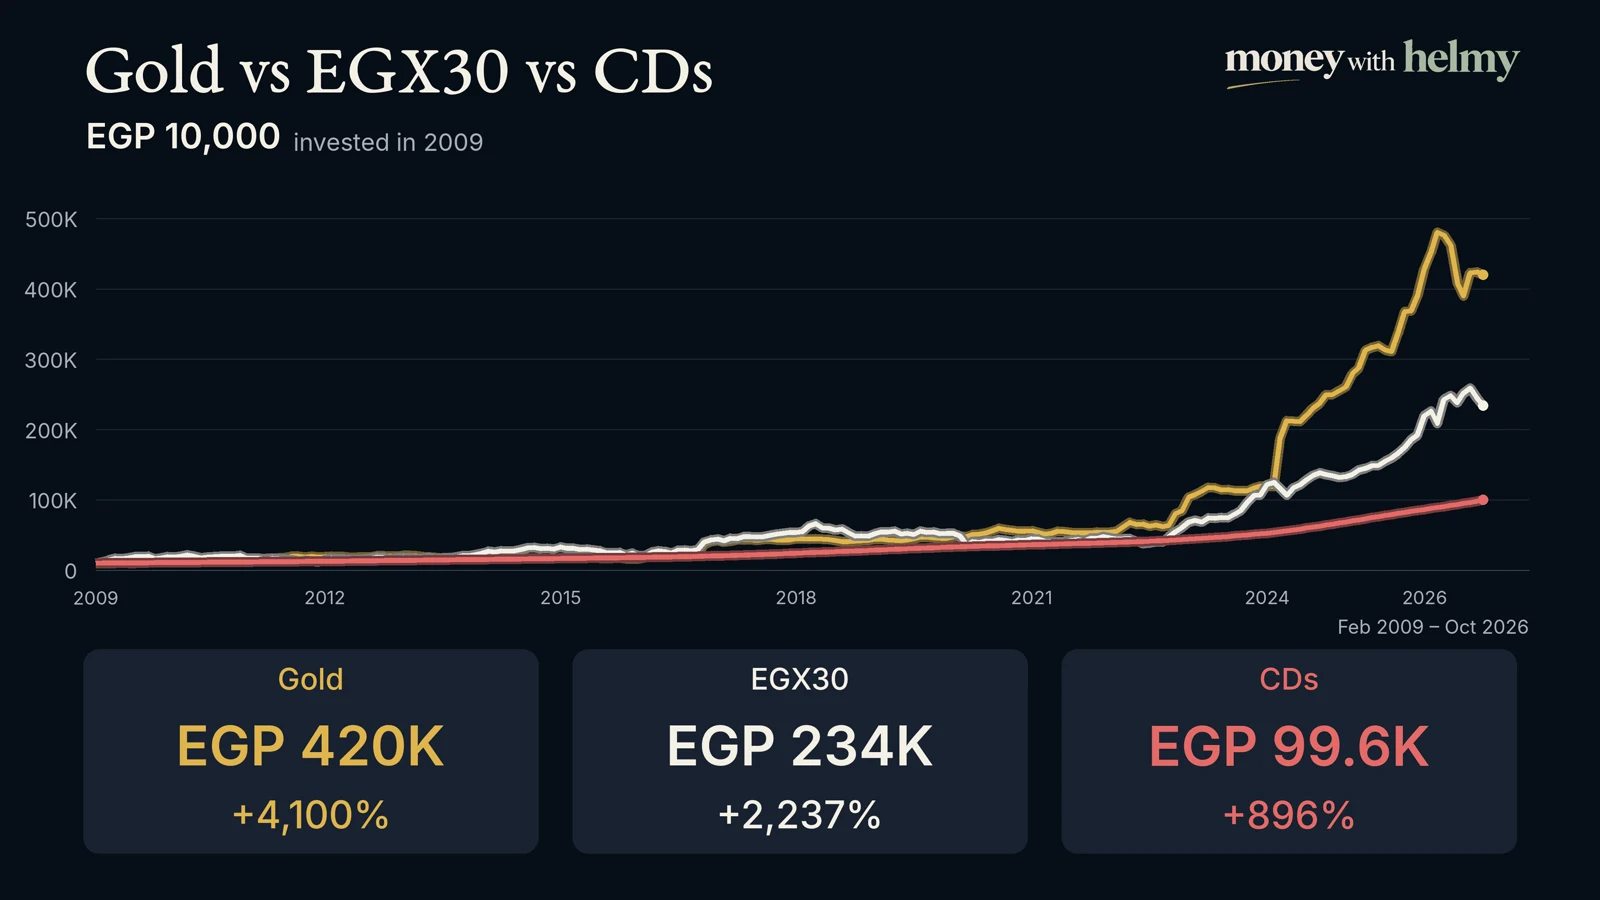
Gold finished first in pounds, followed by the EGX 30 Total Return Index and the modeled bank certificate. The chart also shows how much the value of gold and stocks moved along the way.
EGX 30 includes reinvested dividends. Certificate returns are modeled.
Why gold’s gain was so large in pounds
Two changes compounded. The monthly gold price went from $943 to $4,105 per ounce, about 4.35 times its starting level. The exchange rate went from about EGP 5.56 to EGP 53.65 per dollar, about 9.65 times its starting level. Multiply the two and the gold price proxy in pounds grew roughly 42 times.
That is how EGP 10,000 became about EGP 420,000 in the model. If the goal was priced in dollars, the same gold move was about +335% over the period. For a goal priced in pounds, the next question is how much the thing you’re saving for went up in price.
Gold didn’t lead at every checkpoint
Here’s what the same initial EGP 10,000 looked like at three points along the way.
| Date | Gold | EGX 30 | Certificate model |
|---|---|---|---|
| Dec 2016 | 40,448 | 43,245 | 20,160 |
| Dec 2021 | 53,508 | 47,629 | 38,989 |
| Oct 2026 | 420,010 | 233,696 | 99,616 |
Values in EGP, rounded. EGX 30 includes reinvested dividends.
At the 2016 checkpoint, Egyptian stocks were ahead. By the 2021 checkpoint, gold had pulled ahead. If you had needed the money in 2016, the 2026 result would have been irrelevant to your decision. Compare investments over a period that reflects when you’ll actually need the money.
Growth and income serve different needs
The gold line tracks price growth. The stock line includes reinvested dividends. The certificate line tracks a modeled balance linked to Central Bank of Egypt rates. If you plan to spend the certificate payouts as they arrive, compare the cash you receive plus the principal you get back. Check when the bank pays and what early redemption would cost.
Could you sit through the drop?
Stocks led gold for 78 consecutive months, from September 2013 through February 2020. Across the full comparison, the worst peak-to-trough drop in the monthly data was 48.1% for stocks and 23.4% for gold. Both are measured in pounds, and the drops happened at different times.
Beyond returns
| Investment | Income | Access to your money |
|---|---|---|
| Gold | No regular income | Sell at the dealer’s buy price |
| Stocks | May pay dividends | Sell at the market price |
| Certificates | May pay periodic income | Early redemption depends on bank terms |
What would make an investment right for your goal?
Gold grew the most over this period in Egyptian pounds. For your own goal, consider when you’ll need the money, how much fluctuation you can handle, and whether you want regular income.
- Risk · How big a drop could I sit through without selling?
- Income · Do I need regular payouts or can I let the money grow?
- Liquidity · How quickly can I get my money back, and what would it cost?
- Time horizon · When will I actually need the money?
Data and methodology
- Gold uses the World Bank monthly U.S. dollar gold price multiplied by the average monthly EGP per USD exchange rate. The resulting series is rebased to EGP 10,000. Local retail spreads and storage costs are excluded.
- Stocks use monthly EGX 30 Total Return Index levels, including reinvested dividends, rebased to EGP 10,000. Investment fees are excluded.
- Bank certificates use the original chart’s synthetic, CBE-linked variable rate series rebased to EGP 10,000. The figure represents the modeled series. Actual retail certificate rates, payout terms, and redemption rules depend on the product.
Cumulative change is ending value divided by EGP 10,000, minus one. Figures are nominal and rounded.