
What would EGP 10,000 have become?
At the starting exchange rate, EGP 10,000 was worth about US$2,941. Here’s how that same starting amount would have grown following each index.
| Index | Value in EGP | Value in USD |
|---|---|---|
| EGX 30 | EGP 507,517 | US$9,184 |
| S&P 500 | EGP 1,281,428 | US$23,189 |
Approximate values as of November 4, 2026, using the closing exchange rate for both conversions. The example excludes dividends and costs.
Why the Egyptian market looks different in dollars
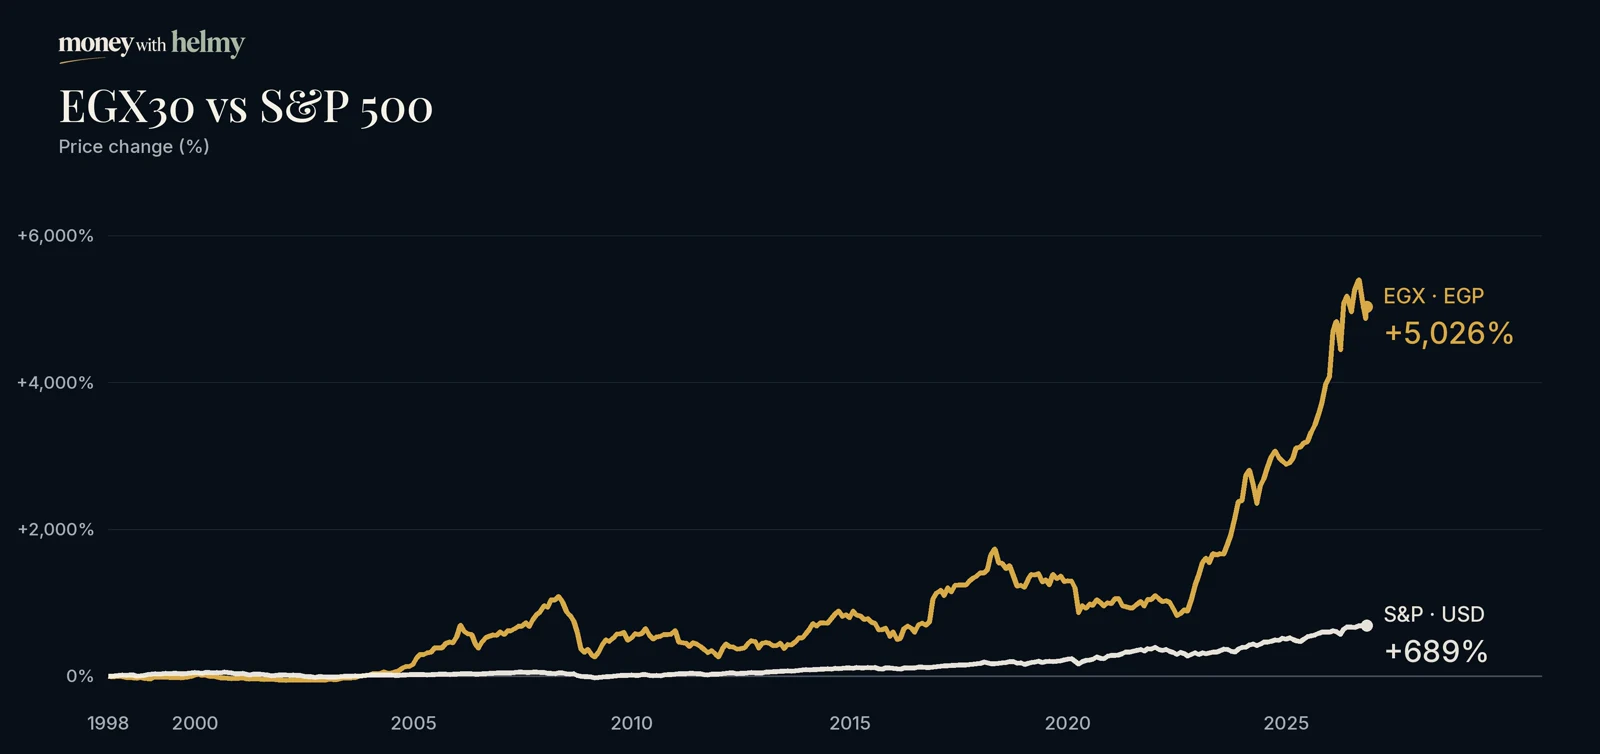
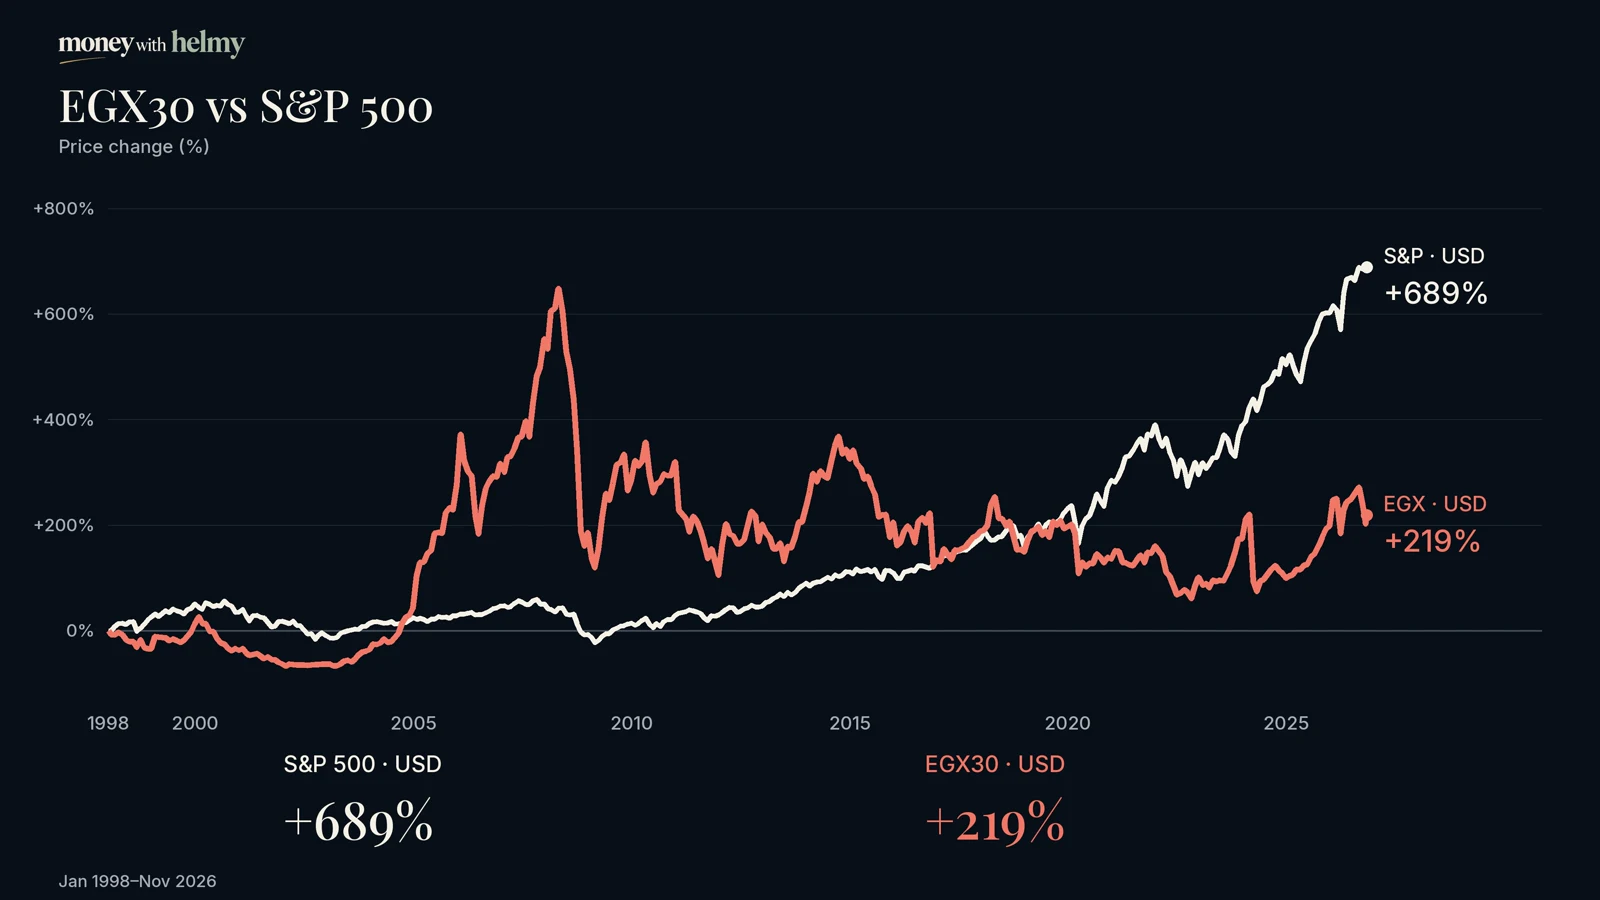
The EGX 30 rose about 50.8 times in pounds. Over the same span, the exchange rate moved from about 3.40 to 55.26 Egyptian pounds per U.S. dollar—roughly 16.3 times as many pounds per dollar. After translating the index path into dollars, its growth is about 3.12 times.
EGX USD growth = EGX growth in EGP × starting EGP/USD rate ÷ ending EGP/USD rateCurrency conversion doesn’t erase what happened in the Egyptian market. It answers a different question: how did that index change translate into dollars over this period?
When a gain in pounds became a loss in dollars
From December 31, 2023 to December 31, 2024, the EGX 30 gained about 19.5% in pounds. Over those same dates, the number of pounds per dollar rose about 64.4%. After conversion, the EGX 30 fell about 27.3% in dollars. The S&P 500 rose about 23.3% in dollars over that window. These are price changes before dividends.
Before you compare two investments
Measure both in the currency you’ll need for your goal. If you’re saving for something priced in dollars, compare both returns in dollars. For a goal priced in pounds, compare both in pounds.
- What currency will I need when I spend this money?
- Am I comparing the same dates and treating dividends and costs the same way?
- After inflation, what could the money actually buy?
Data and methodology
We compare price change with price change: dividends are excluded from both indexes. Each series is rebased to 100 at its starting observation. EGX starts at 998 on January 4, 1998; the S&P 500 starts at 975.04 on January 2, 1998. The starting exchange rate is 3.4005 EGP per USD, dated December 19, 1997.
This is an index comparison, not a backtest of an investable portfolio. It does not include dividends, fees, taxes, or inflation, and the historical source data still need final independent validation. The video uses its original earlier data snapshot; the figures on this page use a common November 4, 2026 cutoff.
Sources: EGX historical archive and index documentation; S&P 500 price series checked against FRED from November 2016 onward; downloaded historical FX series. Figures are a provisional research snapshot.